- Nutrient Absorption
- Buffering with Substrates
- Measuring Total Dissolved Solids & pH
- Run-off Tests
Introduction
Nutrition problems and proper pH balance are some of the most common causes of poor cannabis quality and loss of plant life in both residential and commercial cannabis production. Monitoring and measuring TDS and pH as well as understanding the different attributes of the substrate in use can give growers insight into a plant’s health. Knowing this, it is possible to correct common issues that are damaging cannabis plants.
Nutrient Absorption
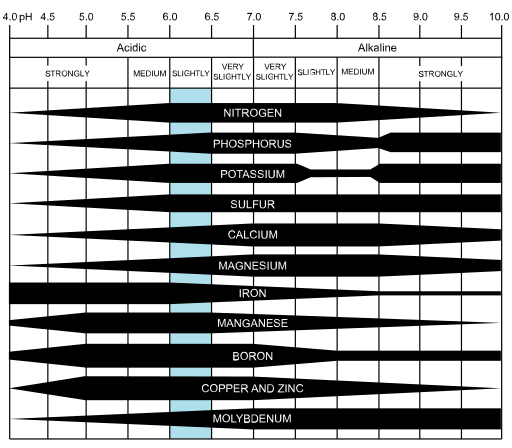
Nutrients are absorbed by plants at different pH levels. The pH level can be affected by the substrate in which a cannabis plant is grown in and by the concentration of nutrients used in a solution mix. Below is a chart showing the effects of pH on nutrient availability for plants. Nutrient deficiency and toxicity symptoms can be caused by an improper substrate pH which prevents nutrients from being absorbed by the plant (1). This is because nutrients can only be absorbed by plants when the pH is balanced within a certain range. For cannabis this range will change depending on the substrate being used and the plant’s growth stage in its life cycle. Several micronutrients are more soluble at a lower pH range when the pH balance of a substrate falls below 5.5, these micronutrients can possibly be absorbed in excess which causes a nutrient toxicity issue. If the substrate pH balance rises above the optimum range, then certain nutrients may not be soluble making nutrients unavailable which causes nutrient deficiency issues.
If plants are given nutrients in excess and the substrate pH is balanced within the optimal range, plants may develop issues due to high TDS levels. In order to correct high TDS levels you will have to irrigate with water to the point of leaching to wash out all of the extra salts within the substrate. This is commonly known as “flushing” in the cannabis growing community. Cannabis clones prefer a more acidic pH around 5.5pH, while vegetative and flowering cannabis plants prefer a slightly acidic pH.
Measuring Total Dissolved Solids & pH
Total dissolved solids (TDS) is a measure of organic and inorganic substances in a liquid. This can actually be measured in terms of Electrical Conductivity (EC) or Parts Per Million (PPM). EC the measure of soluble salts in a solution mix or substrate commonly used in horticulture. A high conductivity reading means there is a high number of dissolved solids in the solution. It is a popular method of determining nutrient strength in a solution. If the conductivity gets too high, your plant can display nutrient toxicity, drought, or fertilizer burn symptoms because roots are restricted from uptaking water due to excessive salts in the substrate even if it is wet. If your conductivity level is too low, then your plants may display nutrient deficiency symptoms. The same can be said for PPM readings. Liquid plant nutrients are essentially solid salts that have been dissolved into a water solution, allowing nutrients to be absorbed ionically through the roots of plants. Seedlings and clones will need less nutrients than older and larger plants, but as they grow they will need more and more nutrients. It is also true that certain cannabis strains will prefer a milder nutrient strength mix while other strains prefer a stronger mix. If you are following a nutrient chart and you need to convert EC to PPM or vice versa, then it is important to understand a few factors that affect conversions. The conversion rates are different depending on which country you live in. The United States commonly uses 0.50 for its conversion while many other countries use either 0.64 or 0.70 for conversion rates. This is why using PPM is seen as a less accurate measurement than EC. EC is considered more accurate than PPM and is preferred for scientific purposes, but PPM meters are still commonly used TDS meters for both commercial and residential cannabis production (2). The Electrical Conductivity of your nutrient solution can be measured by a EC meter which applies a small electrical voltage causing mineral ions in the solution to move. This movement is measured to get a reading. Many PPM meters display a conductivity measurement compared to a sodium chloride (NaCl) reference solution which is very close to half of its conductivity value. Other reference solutions that are available include potassium chloride (KCl) solutions and 442 solutions. These solutions are also used for calibration of the meter. This is important to know because your TDS readings can be inaccurate unless you follow the conversion rates properly when converting your TDS value or measuring TDS correctly when following a feed chart.
It is easy to convert a ppm value based on a sodium chloride reference solution to an EC value. In order to do so you would take the ppm value and multiply it by 2 and then divide by 1000.
500ppm * 2 = 1000 / 1000 = 1 EC
It is also easy to convert approximate ppm value based on a sodium chloride reference solution, in order to do so you would multiply the EC reading by 1000, then divide by 2.
1 EC * 1000 = 1000 / 2 = 500ppm
Nutrient solution total dissolved solids and pH are both commonly measured inside the growing facility. You can find devices that measure pH, ppm, or EC. Some of these devices can be a combination of ppm and EC meters or pH and ppm meters. There is also a liquid solution that can determine an approximate value for the pH of a liquid. The cost of these devices can range wildly from as low as $30 to $300+ depending on the quality and manufacturer.
Run-off Tests
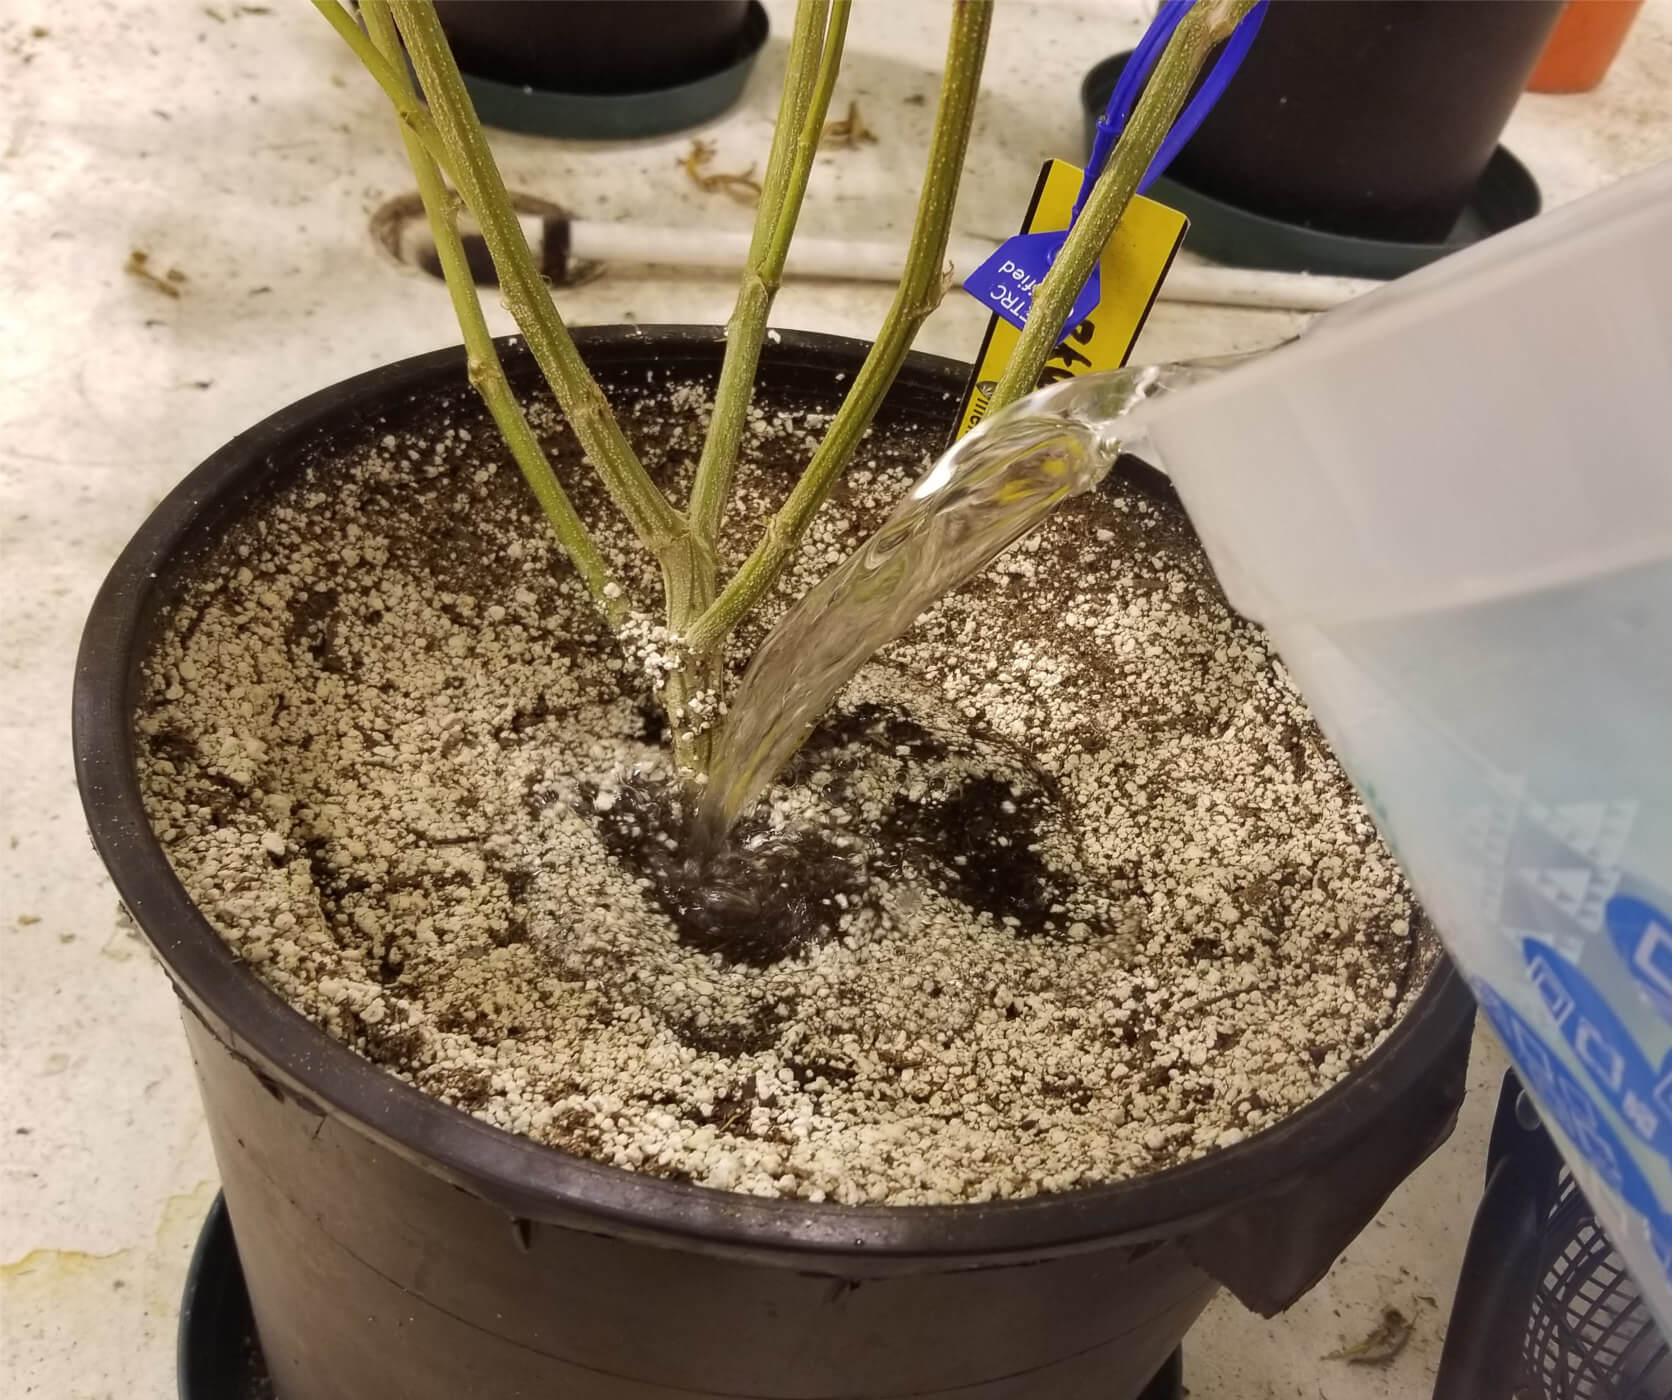
Run-off tests are one way of providing TDS and pH data from the substrate. It essentially samples from the entire root zone, is non-invasive, and can be used on a variety of substrates. It is important to irrigate the substrate adequately to get an accurate run-off test. Sampling from drier pots may result in greater TDS because of higher salt concentration. Adding too much water would dilute the sample and result in a lower TDS measurement. Irrigating the crop as usual and monitor the volume of water added to minimize these sources of variation. The goal is to apply just enough filtered water to collect as close to 50 milliliters of leachate as possible. More than 70 milliliters of leachate can dilute the salt content, while less than 50 milliliters of leachate may not provide enough solution to cover the probe. Pour the run-off solution through a filter such as a coffee filter to avoid getting the substrate in the solution. Then, measure this solution to gather data on the TDS and pH levels of the substrate. Testing the substrate by sticking a sensor directly into the substrate to take readings is usually not recommended as it could burn out the probe. There are other ways to test the substrate, but this is the easiest and most common method of collecting data from the substrate. It is recommended that a grower takes five to ten run-off samples from each crop type.
Comments powered by Talkyard.